Setting up a Monitor
Start monitoring your websites and servers successfully.
Start monitoring your websites and servers successfully.
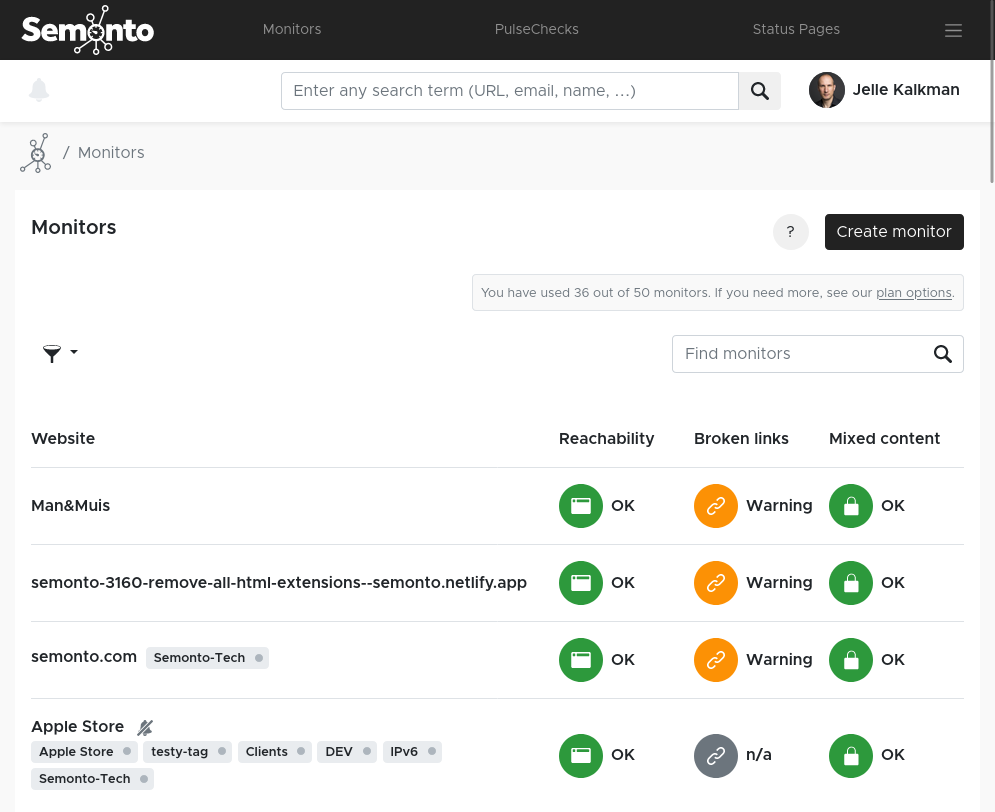
Monitors are the main feature of Semonto. With a monitor, you can keep an eye on the availability and behaviour of a website, server or web application.
Whenever something unexpected happens, you get notified so that you can fix the problem quickly.
One thing to keep in mind. If you want to monitor a server, it needs to be reachable over the internet. Otherwise, you are better off creating a PulseCheck.
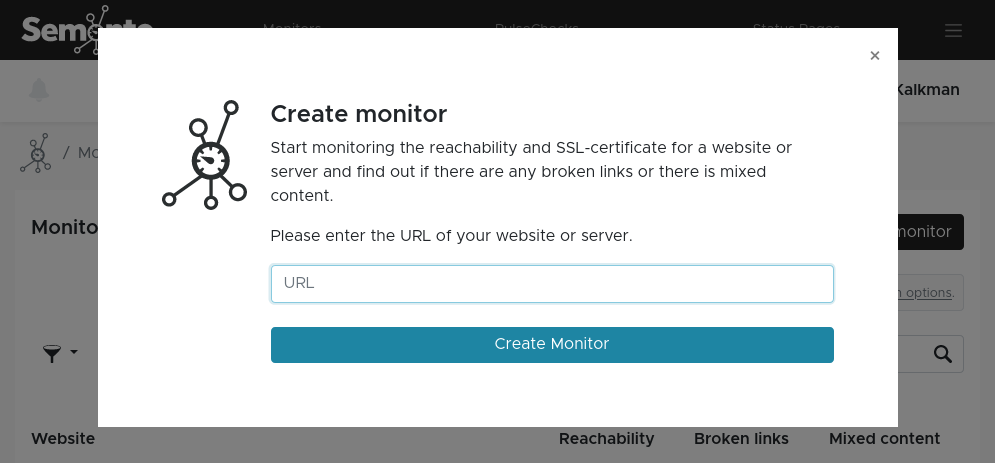
The cool thing about Semonto is that you can customize it to your needs. For example, a website owner can use a monitor to make sure that his website is always available. A server owner can create a more advanced monitor to get notified when the available disk space is low or to get alerted when a maintenance task was not executed in time. So you can test only the basics or create very specific and advanced tests. To make it easy for all users, some default tests are automatically activated when you create a monitor. Custom tests, on the other hand, are for advanced users and have to be added manually.
You will now get a message that the monitor was created. At this point, Semonto will start monitoring the availability. You can come back later to the dashboard to see the results. Don’t worry, if anything happens in the meantime, you will receive an email alert. If you are an advanced user and want to add more configuration to the monitor, select ‘Configure this new monitor’.
There are times when you do not want your monitor to perform any tests. For example, you do not want notifications to go out during planned maintenance. In that case, you can temporarily pause the monitoring. Just go to ‘Monitors’, click on the monitor in question and select ‘Pause monitoring’. Do not forget to switch it back afterwards.
If you want to continue monitoring but want to turn off notifications for a certain period of time, go to Notifications and turn off the “Notifications are enabled”-switch.
When you go to Monitors and click on a URL, you can select ‘Configure reachability tests’, where you can edit the settings. Some settings have been entered by default so that you do not need to change anything to start monitoring. However, you are free to adapt them to your needs.
These are the general settings of a monitor
You can change the test location to better suit your needs. For example, if you are located in the USA, you might want to test from San Francisco or New York first.
Tags can be used to filter your view if you have a large number of monitors and/or PulseChecks. You can, for example, add the tag ‘internal’ or ‘external’ to make a distinction between your own monitors and those for your customers. Or you can sort them by their server, by purpose, or even by hosting company. Any monitor can have multiple tags. Tags are only visual and have no effect on the performance of your monitoring. They can be applied across Monitors and PulseChecks.
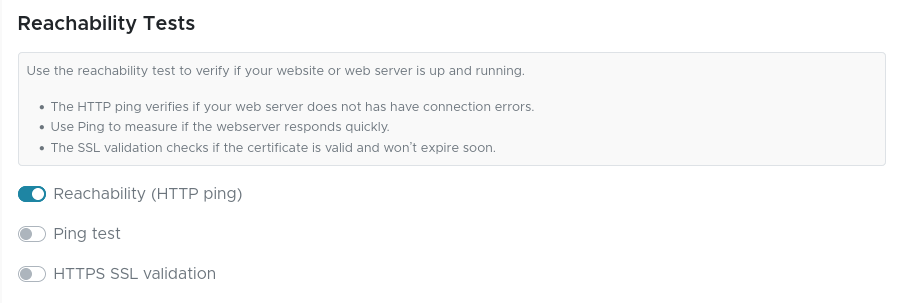
To make Semonto as user-friendly as possible, some tests have already been created by default. A few tests are automatically enabled, others are disabled until you activate them.
Reachability (HTTP ping) tells you whether your website or server is currently available, whether it responds quickly, and it shows you the response time. HTTPS SSL Validation is also active by default. It tells you whether your security chain is valid and warns you if any problems arise. Semonto can also verify if specific ports are available which is useful if they are essential for one of your services. To enable port testing, simply add the name of the port you would like to monitor.
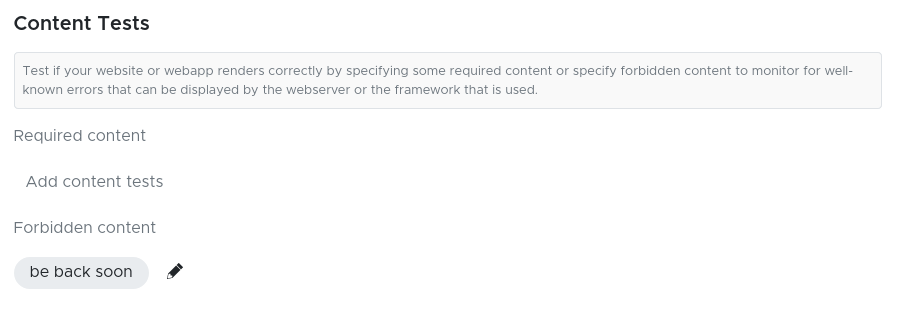
If you want, you can also perform content tests. They tell you whether certain words or phrases are either present on your website or missing, which could indicate that something is wrong. For example, sometimes websites display ‘will be back soon’ when they are offline. If you enter this phrase as forbidden content, you will receive an alert immediately when it appears.
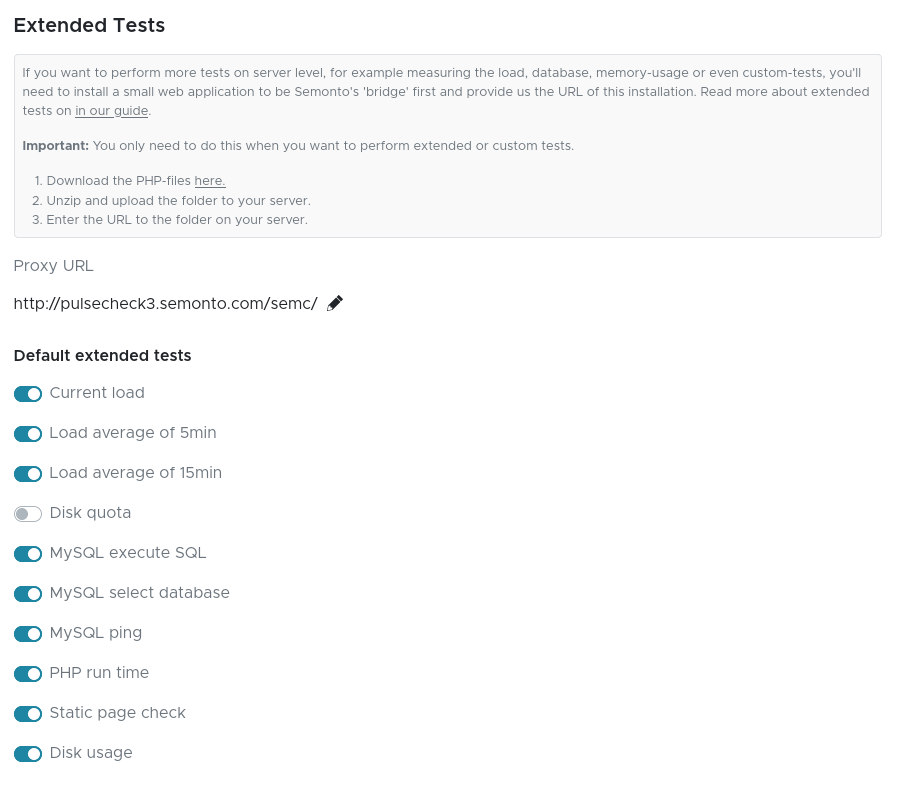
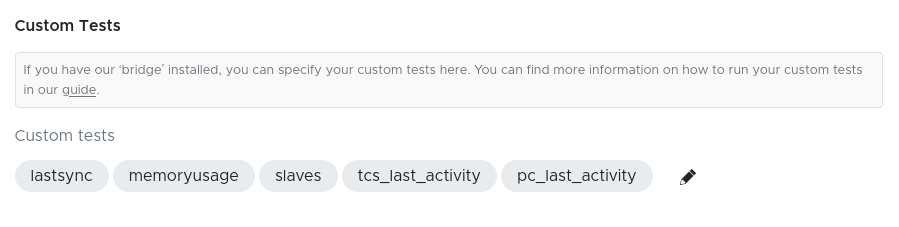
When you are monitoring a server, you might want to measure some more advanced parameters, such as the server load, database accessibility or memory usage. This is information that is usually not publicly available, so we need to build a ‘bridge’ to get to this information in a safe way. To do this, you will need to install a small web application and give us its URL. You only need to do this when you want to perform extended or custom tests.
Sometimes, it can be useful to know the IP-addresses of the Semonto servers. Be sure to allow these IP-addresses in your firewalls, if you are using any. If you use log analyzers, you can filter those IP-addresses to ignore Semonto's hits/requests. Be sure to allow at least all Verification-servers and the TestCenters you use. When we perform a major upgrade, it is possible that another than the preferred TestCenter performs your tests. It is best to allow all our IP-addresses. The IP-addresses can be found in Semonto's dashboard, on the bottom left side of your screen, under the question mark button.
When you would like to perform extended or custom tests, you need to supply a URL to the ‘bridge’ for Semonto to be able to find and perform those tests. This is because Semonto does not has access to your server settings or database configuration for example. This is for security reasons. If you want to monitor your database or want to keep an eye on the server-load, you will need to install a small web application on your server, the 'bridge'. This allows Semonto to access the needed data, without having too much access.
We provide some standard web applications available for you, at the moment written in PHP and a start in Ruby-On-Rails publicly accessible at GitHub. Feel free to use these and add more functionality.
The 'URL to Bridge' should be the URL to the main-root of the web application and should end with '/'. If you use PHP and the files are the directory semc in the root of your htdocs, the URL needs to be: https://myserver.com/semc/.
If you use Ruby-On-Rails, the path needs to be on the routings you defined for Semonto.
With this 'bridge' running on your server, you can also implement custom tests, tests written for your specific needs. Custom tests need to be implemented in the web application as explained in the section above. Let say Semonto wants to perform the test X, the called URL will be the URL to bridge'?test=X, for example: https://myserver.com/semc/?test=X.
It's up to your webapp to handle this GET-variable and print the correct test-result. The answers of the webapplication should be formatted as: X::INFO::MORE_INFO. Where X is the status, with:
If you need more support on this, feel free to email us at info@semonto.com.