Get the most out of an uptime report
In this guide, we explain what information you can retrieve from the uptime reports in the Semonto dashboard and how to interpret the results.
In this guide, we explain what information you can retrieve from the uptime reports in the Semonto dashboard and how to interpret the results.
An uptime report shows the percentage of time your website, webshop or server has been working and available. It also lists the number of times problems occurred and how long these issues lasted. An uptime report is an objective tool to measure the availability of your service.
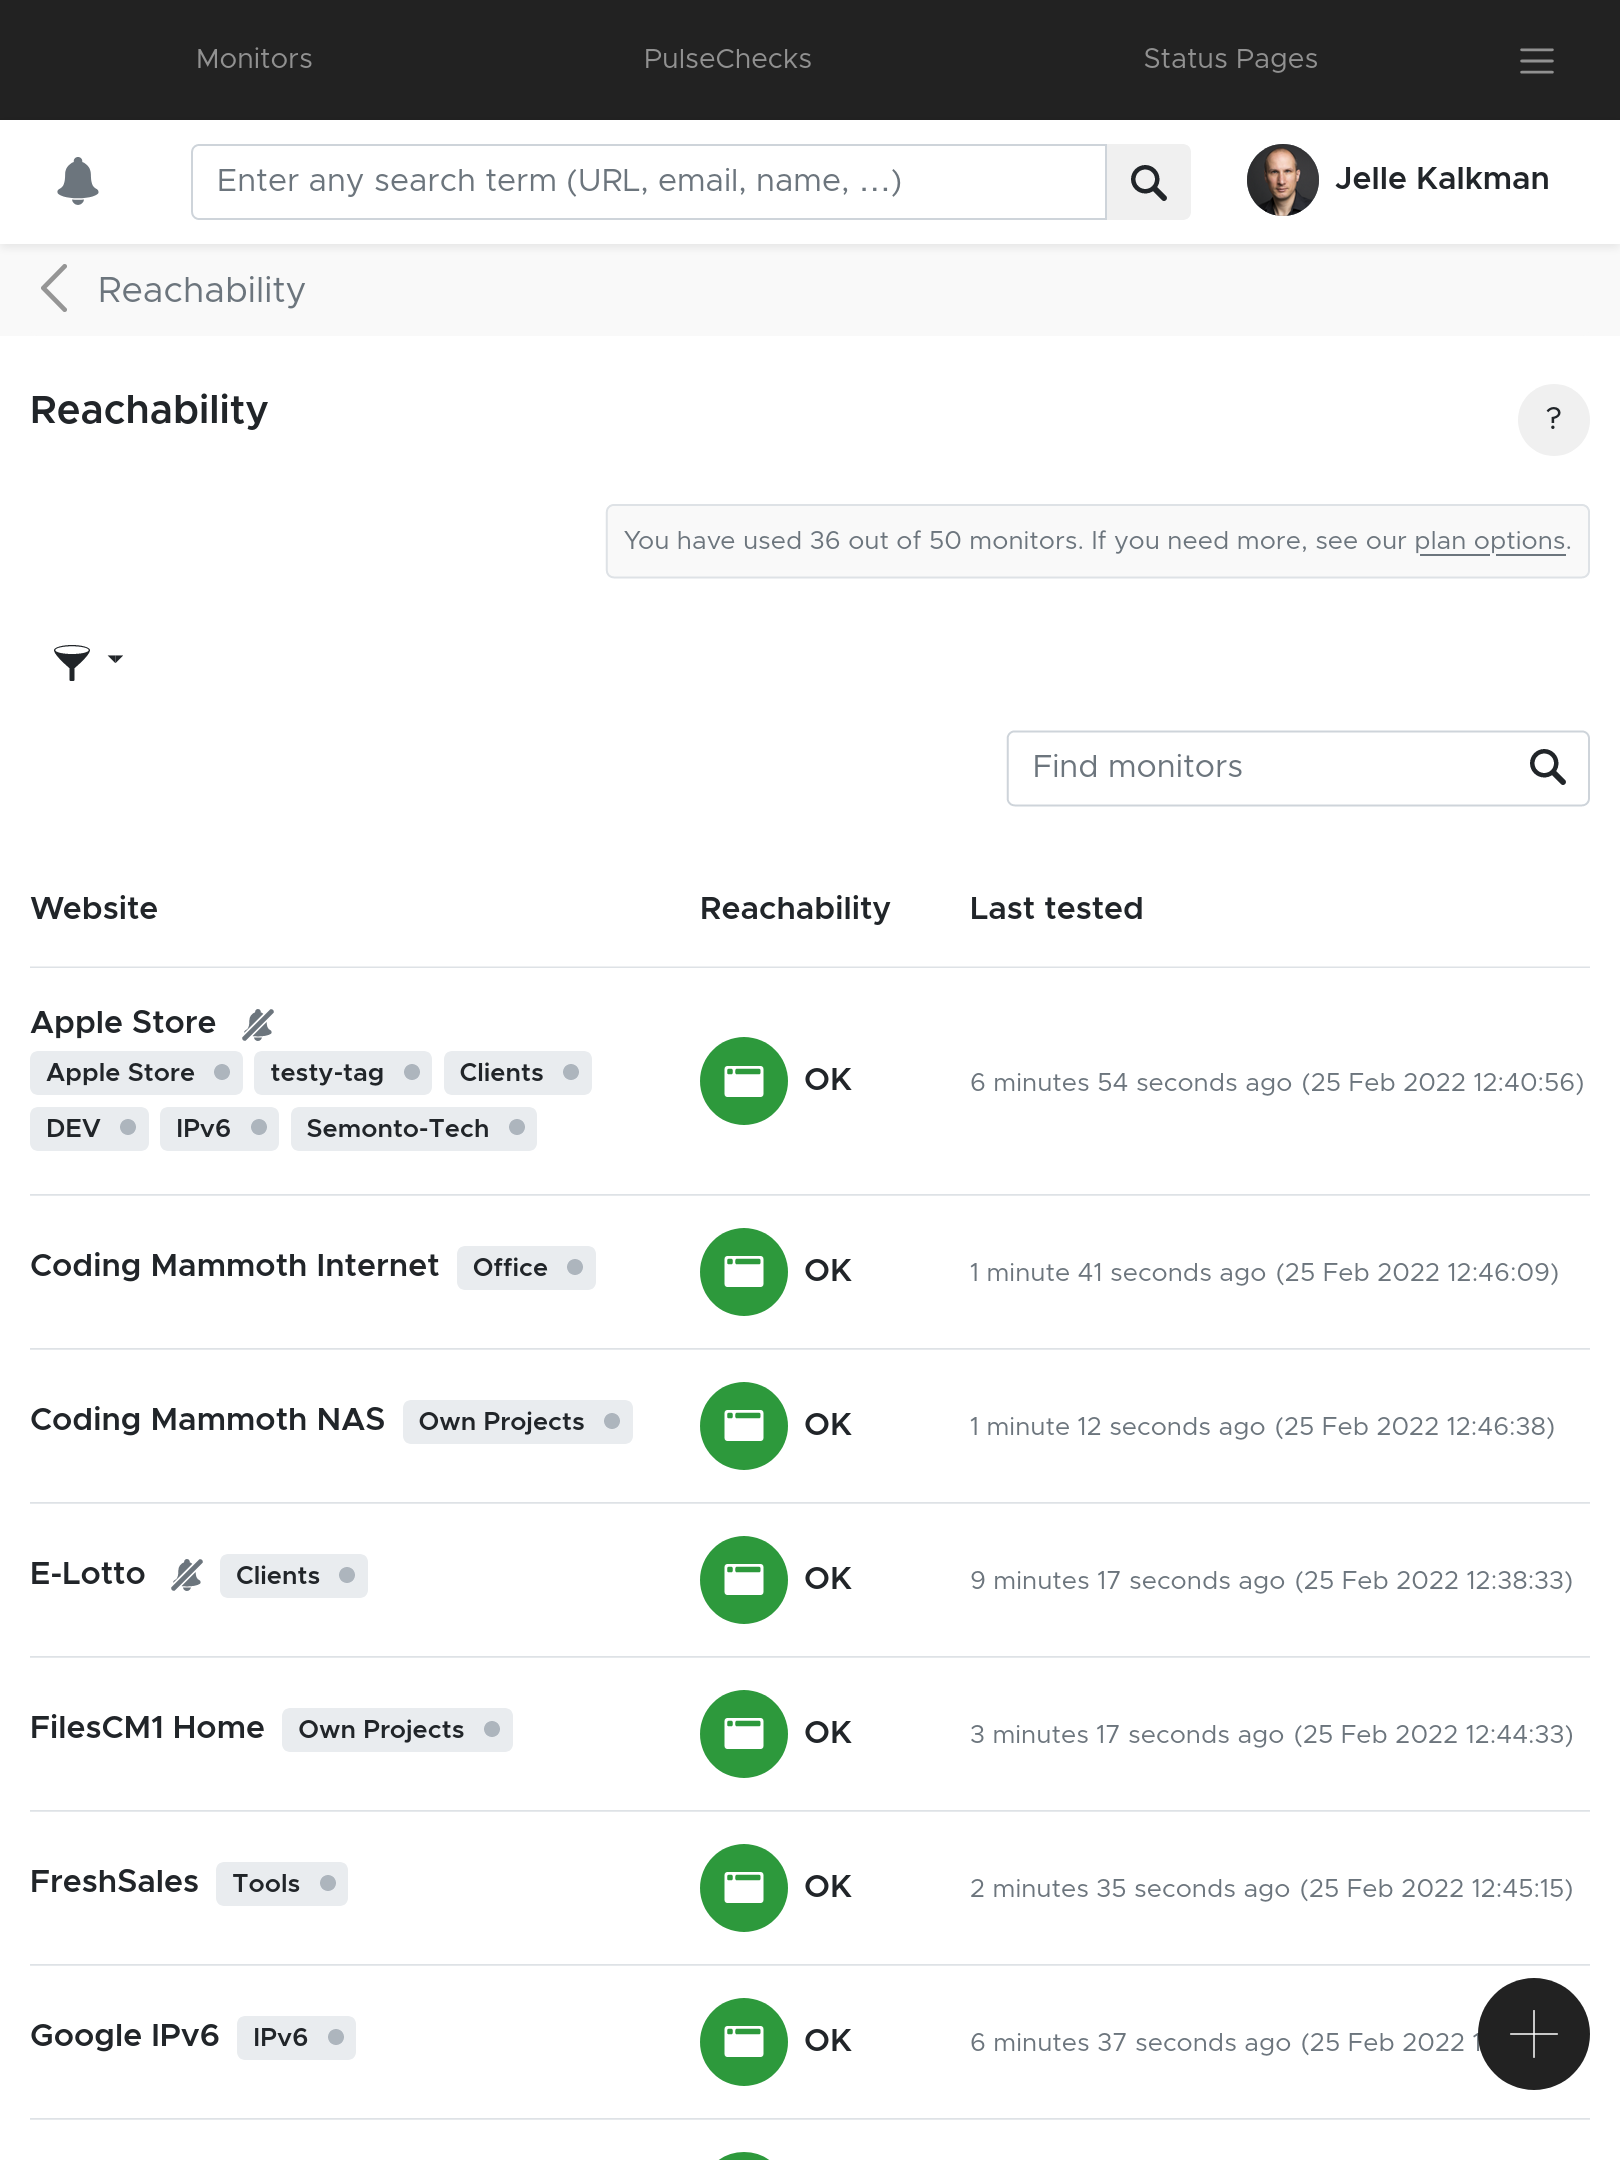
Sign into the Semonto dashboard. and select Reachability in the left menu. Click on the URL of your choice and then select ‘Show uptime report’.
There is also a direct link to the uptime reports from the 'Details' section.
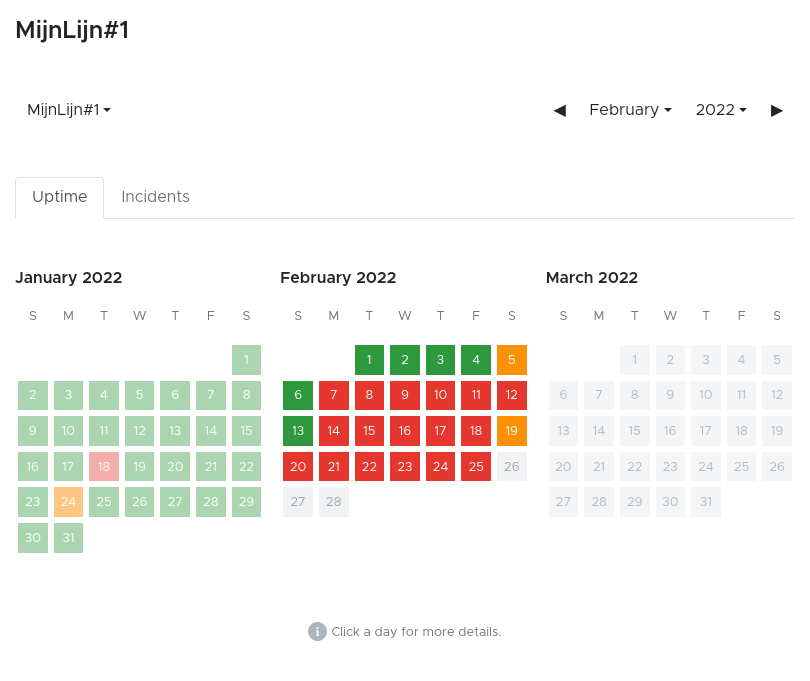
The uptime report reads like a calendar. For each day, you can see whether Semonto found issues with your monitor. Days with errors appear in red, days with warnings are orange and days without problems are green.
If you want to inspect what has happened on a specific day, you can also click on that day in the calendar. Semonto will show you which tests have failed, triggered a warning and succeeded. From there, you can select the results of a specific test for further investigation or go to the incident report to see all the incidents.
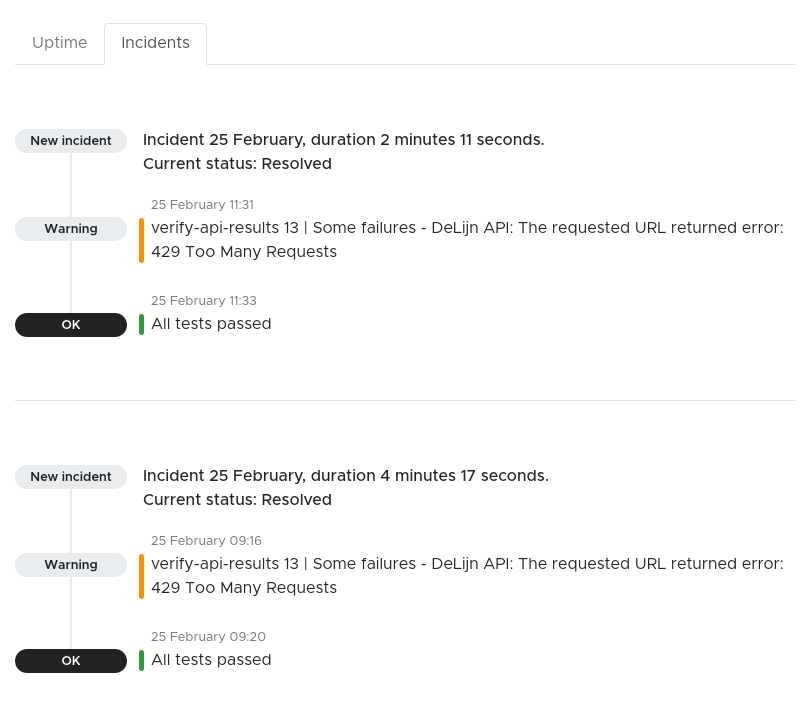
If any issues have occurred, a 'Show Log' button will appear in the right top corner. This button gives you access to a more detailed log on the events that happened in the selected month. The detailed report mentions which test(s) have failed, and the exact timestamp and duration of the issue.
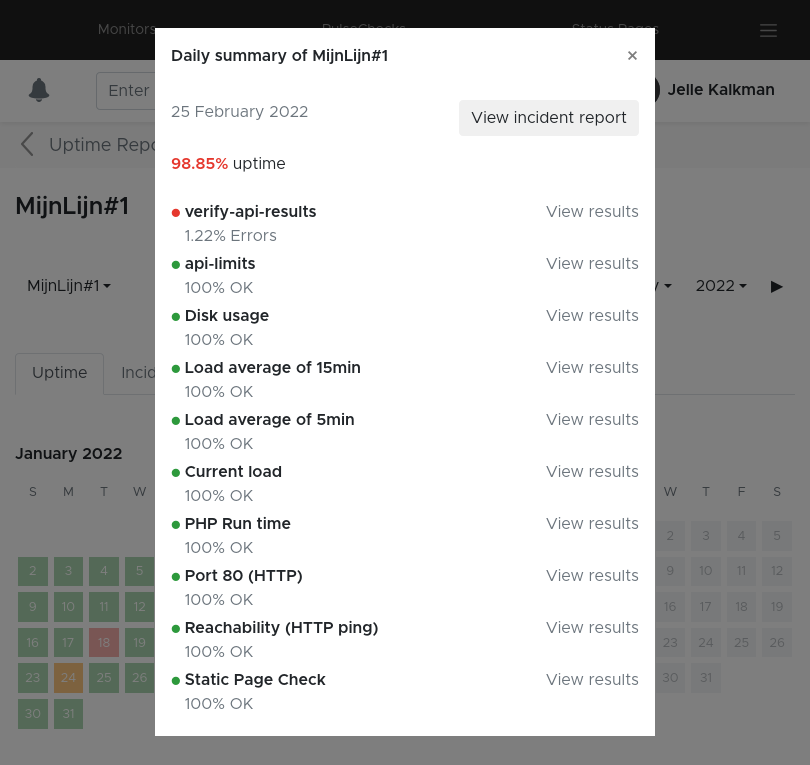
If you want to inspect what has happened on a specific day, you can also click on that day in the calendar. Semonto will show you which tests have failed, triggered a warning and succeeded. From there, you can select the results of a specific test for further investigation.
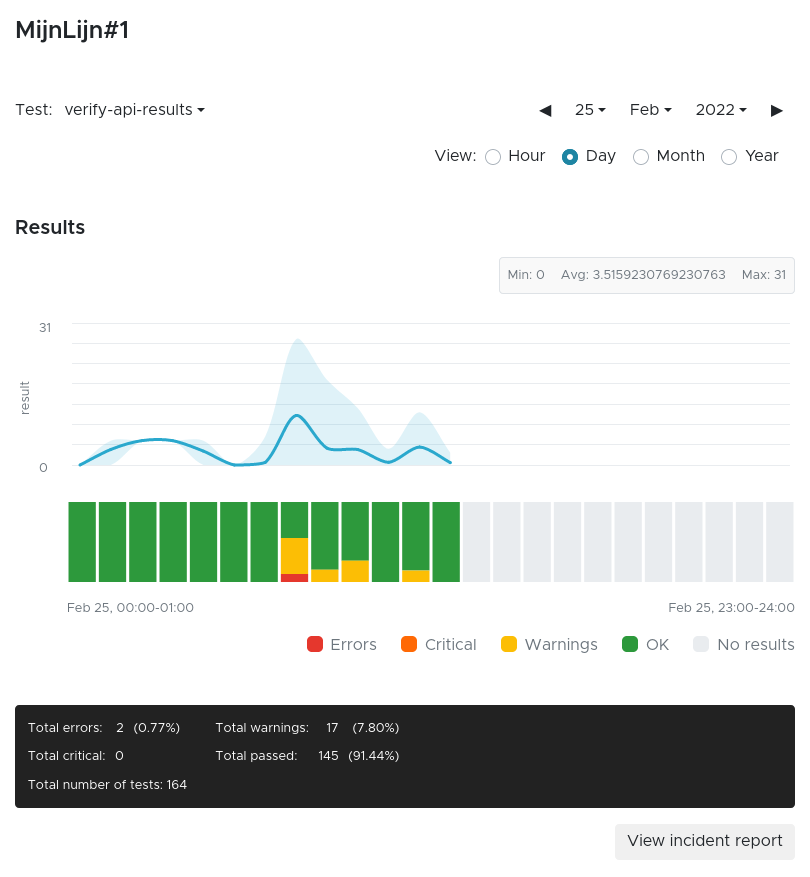
Within the results of a specific test, you can select a year, month, day or hour for further analysis of the performance. If you select a year, you find the results for each month in that year. When you choose a month, you will find the results for each day within that month. For a day, the results will show every hour on that day. When you select the hour view, you can inspect more precisely when a test has failed.
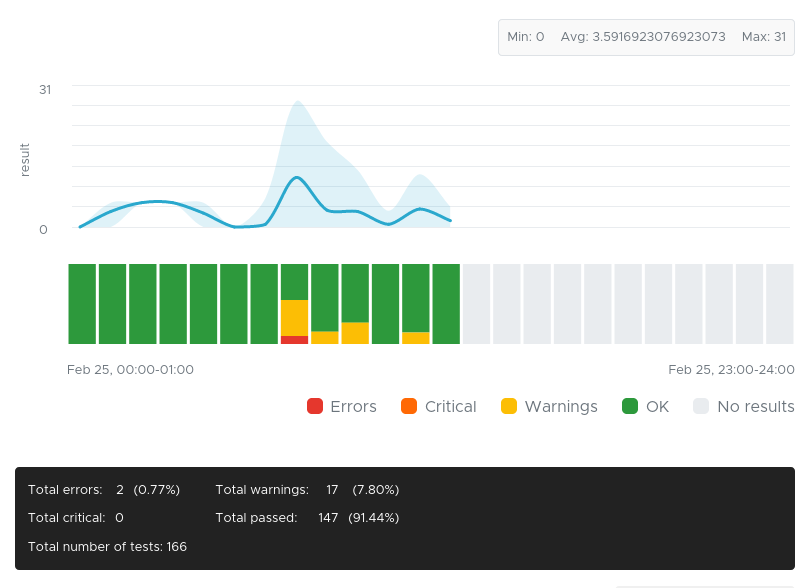
Within this view, you also have the option to enter the log with the 'Show Log' button if any issues occurred. And you can easily select another test within the same timeframe with the selector directly above the chart to the left. When you hover above the chart, a tooltip shows the results, allowing a quick overview. For a more thorough inspection, you can use the tables below the graphs.
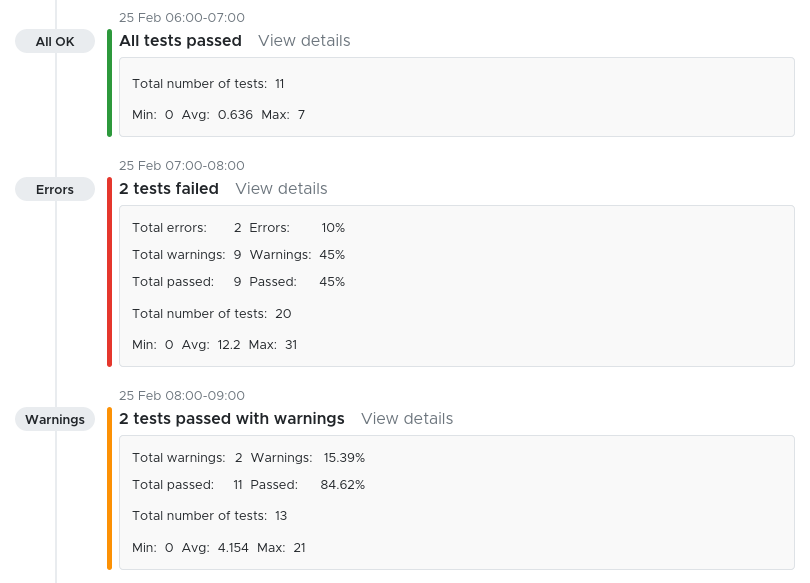
For example, you can see that between 07:00 and 08:00, some tests failed and others resulted in warnings. You can navigate to the specific hour with the link at the righthand side of the table.
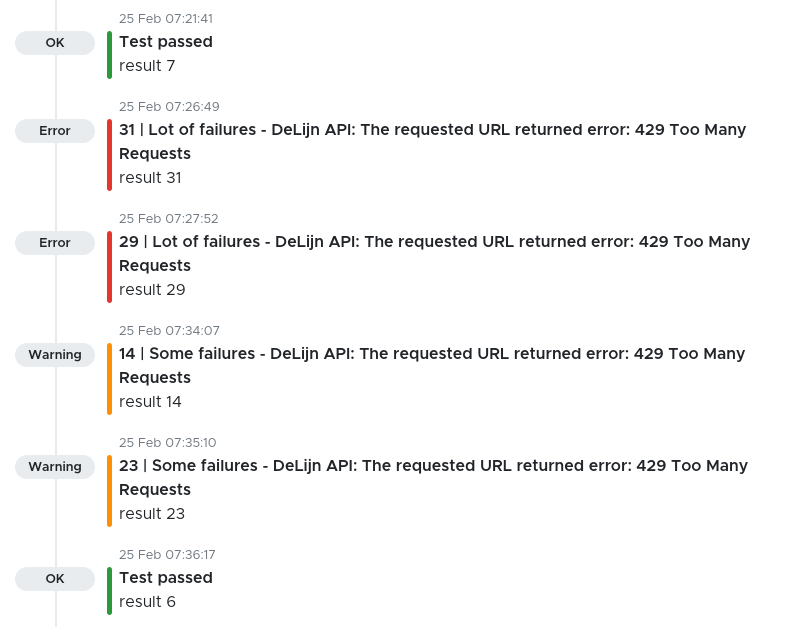
Now you know how to find the exact moments when your website or server has failed. In this example, we have used results from our custom tests. You can use our guide on the most common errors to better understand what has gone wrong so you can prevent these issues from happening again and improve the uptime of your monitor.